Debugging: Difference between revisions
No edit summary |
No edit summary |
||
| (5 intermediate revisions by the same user not shown) | |||
| Line 1: | Line 1: | ||
This | == Debugging your own code == | ||
This guide will teach you on how to debug your Lua code and WebUIs. | |||
<div class="noprint" style="float:right;"> | <div class="noprint" style="float:right;"> | ||
[[File:clientOption.png|Steam Client Options]] | [[File:clientOption.png|Steam Client Options]] | ||
</div> | </div> | ||
Debugging is the process of adding messages into your code to provide insight of the script's process or working. The debugging helps us to find out where the issue occurs, which can help us where exactly our issue is present or is coming from. The errors in the code can be a huge problem as they can skip the code or crash the server where they occur. | |||
This process is based on few different techniques, the first one is to add (print) messages, which can help you which part of the code gets run and what values you are getting. | This process is based on few different techniques, the first one is to add (print) messages, which can help you which part of the code gets run and what values you are getting. | ||
The second technique is to add this piece of code in your server side script, and as for the client you can run the game with '''-dev''' launch argument to run the game in development mode, which prints client side script errors in the chat if you have this piece of code in your script* and also you can find the errors in your '''%appdata%\..\Local\Onset\Saved\Logs''' folder. | The second technique is to add this piece of code in your server side script, and as for the client you can run the game with '''-dev''' launch argument to run the game in development mode, which prints client side script errors in the chat if you have this piece of code in your script* and also you can find the errors in your '''%appdata%\..\Local\Onset\Saved\Logs''' folder. | ||
Code*: | Code*: | ||
| Line 31: | Line 30: | ||
</syntaxhighlight> | </syntaxhighlight> | ||
=== Client Console === | |||
For a more convenient development you can open the game console and add your own commands. [[OnConsoleInput]] (Since version 1.3.0) | |||
To open the console press one of the default keys: ~, ß, ^ | |||
You can add console keys to this ini file: %LocalAppData%\Onset\Saved\Config\WindowsNoEditor\Input.ini | |||
<pre> | |||
[/Script/Engine.InputSettings] | |||
ConsoleKeys=´ | |||
</pre> | |||
''Note that developer mode (-dev) must be enabled for the console to work.'' | |||
Press the console key two times to get the large console from the top of the screen. | |||
[[File:ClientConsole.PNG|900px]] | |||
=== Debugging WebUIs === | |||
In game version 1.0.3, a feature was introduced to debug WebUIs. Inspect your Onset UI in Google Chrome. Start Onset with the '''-dev''' flag and connect to '''localhost:9222''' in Chrome. You can specify a different port to Onset like this: '''-cefdebug=1337'''. You can use '''alert("")''' in your Javascript code to test it. The errors in your Javascript code can also be found in '''%AppData%\..\Local\Onset\Saved\Logs\cef3.log'''. | |||
[[File:cefdebug.png|1000px]] | |||
== Debugging server crashes == | == Debugging server crashes == | ||
| Line 41: | Line 60: | ||
If the key ''LocalDumps'' does not exist then create it. Inside of the ''LocalDumps'' key create another one named ''OnsetServer.exe''. | If the key ''LocalDumps'' does not exist then create it. Inside of the ''LocalDumps'' key create another one named ''OnsetServer.exe''. | ||
Now right click on the right side and create a new value with the name ''DumpType'' and set data = 2 | Now right click on the right side and create a new value with the name ''DumpType'' and set data = 2 | ||
The .dmp crash dump files will be in the folder <pre>%LOCALAPPDATA%\CrashDumps</pre>. | The .dmp crash dump files will be in the folder: <pre>%LOCALAPPDATA%\CrashDumps</pre>. | ||
[[File:WERregistry.PNG]] | [[File:WERregistry.PNG]] | ||
=== Linux === | === Linux === | ||
Before launching your Onset Server execute the following command in a terminal. | Before launching your Onset Server, execute the following command in a terminal. | ||
<pre>ulimit -c unlimited</pre> | <pre>ulimit -c unlimited</pre> | ||
Core crash dump files should appear in the same folder as your server executable with the name "core" in it. | Core crash dump files should appear in the same folder as your server executable with the name "core" in it. | ||
Latest revision as of 16:26, 8 October 2020
Debugging your own code
This guide will teach you on how to debug your Lua code and WebUIs.
Debugging is the process of adding messages into your code to provide insight of the script's process or working. The debugging helps us to find out where the issue occurs, which can help us where exactly our issue is present or is coming from. The errors in the code can be a huge problem as they can skip the code or crash the server where they occur.
This process is based on few different techniques, the first one is to add (print) messages, which can help you which part of the code gets run and what values you are getting.
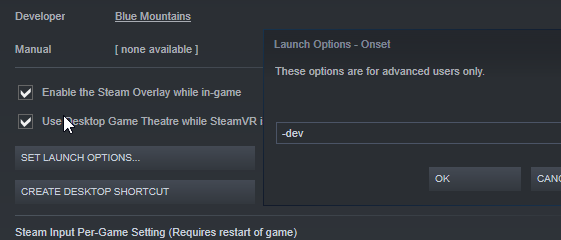
The second technique is to add this piece of code in your server side script, and as for the client you can run the game with -dev launch argument to run the game in development mode, which prints client side script errors in the chat if you have this piece of code in your script* and also you can find the errors in your %appdata%\..\Local\Onset\Saved\Logs folder.
Code*:
--[[
    If a script error occurs display it in server log.
]]--
AddEvent("OnScriptError", function (message)
    print('SCRIPT ERROR: '..message)
end

--[[
    If a script error occurs display it in the chat.
    This only works if the game was started with "-dev" switch
]]--
AddEvent("OnScriptError", function (message)
    AddPlayerChat('<span color="#ff0000bb" style="bold" size="10">'..message..'</>')
end
Client Console
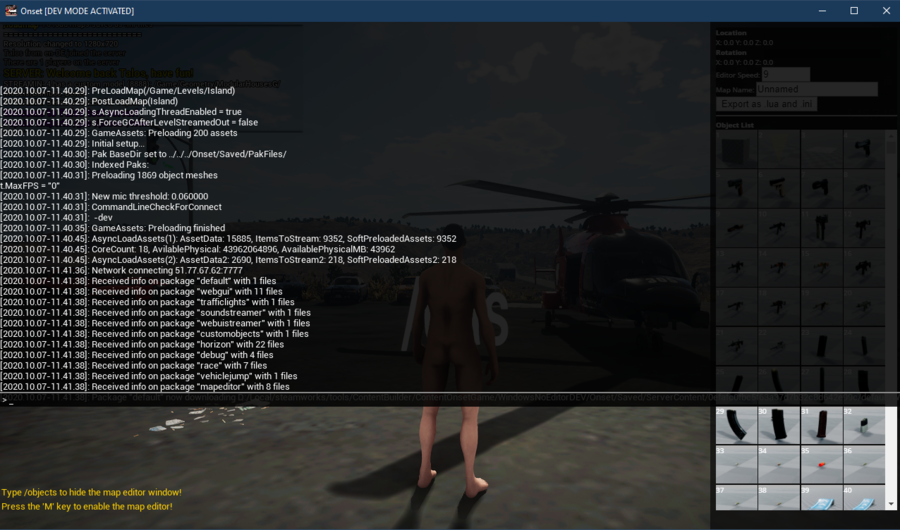
For a more convenient development you can open the game console and add your own commands. OnConsoleInput (Since version 1.3.0) To open the console press one of the default keys: ~, ß, ^
You can add console keys to this ini file: %LocalAppData%\Onset\Saved\Config\WindowsNoEditor\Input.ini
[/Script/Engine.InputSettings]
ConsoleKeys=´
Note that developer mode (-dev) must be enabled for the console to work.
Press the console key two times to get the large console from the top of the screen.

Debugging WebUIs
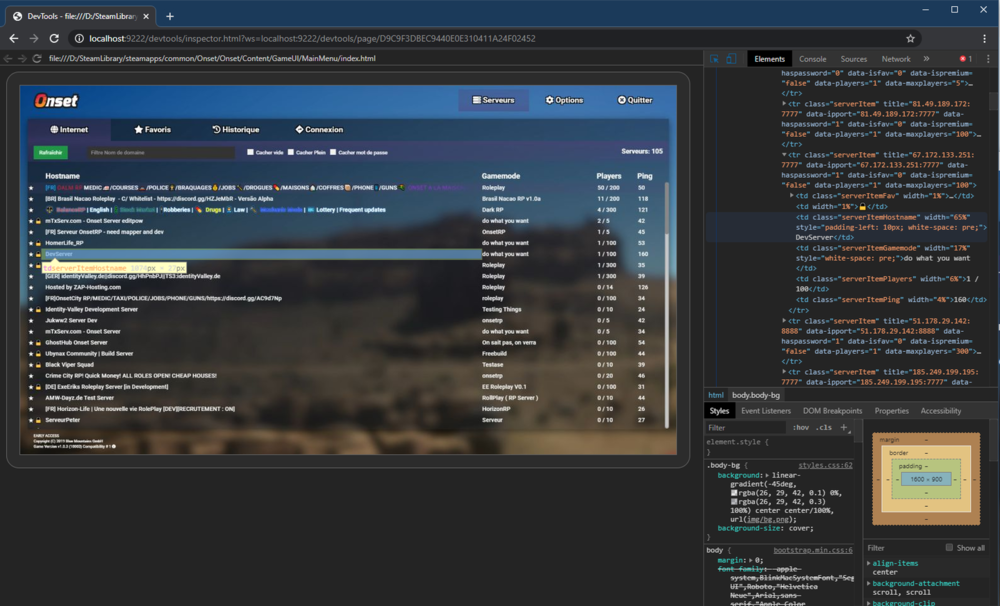
In game version 1.0.3, a feature was introduced to debug WebUIs. Inspect your Onset UI in Google Chrome. Start Onset with the -dev flag and connect to localhost:9222 in Chrome. You can specify a different port to Onset like this: -cefdebug=1337. You can use alert("") in your Javascript code to test it. The errors in your Javascript code can also be found in %AppData%\..\Local\Onset\Saved\Logs\cef3.log.
Debugging server crashes
In case your Onset server crashes and you have no idea why, you can enable crash dumps that contain useful information about the crash. The crash dump files should be sent to the developer of the game who can then take a closer look at them.
Windows
In the registry (regedit.exe) go to the following location:
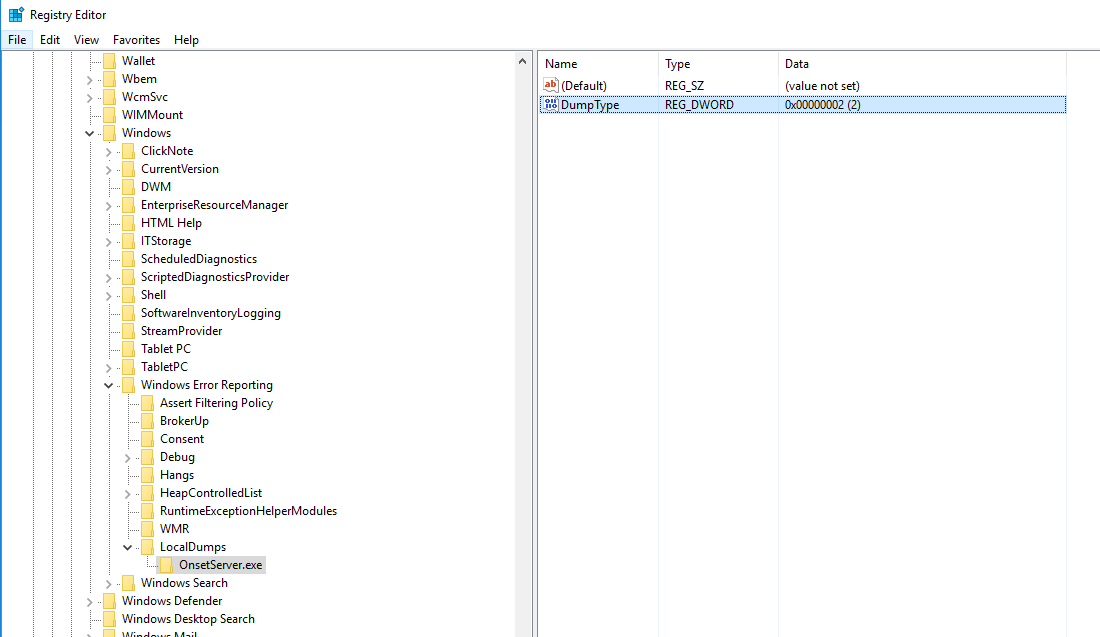
HKEY_LOCAL_MACHINE\SOFTWARE\Microsoft\Windows\Windows Error Reporting\LocalDumps
If the key LocalDumps does not exist then create it. Inside of the LocalDumps key create another one named OnsetServer.exe. Now right click on the right side and create a new value with the name DumpType and set data = 2
The .dmp crash dump files will be in the folder:
%LOCALAPPDATA%\CrashDumps
.
Linux
Before launching your Onset Server, execute the following command in a terminal.
ulimit -c unlimited
Core crash dump files should appear in the same folder as your server executable with the name "core" in it.


